Appearance
Debug mode
Debug Mode is a diagnostic tool in AireGlu that provides additional contextual information about endpoint executions. When enabled, Debug Mode records detailed information about each step in your endpoint's processing pipeline, allowing you to inspect the inputs, outputs, and behavior of your tasks.
When Debug Mode is enabled, the following features are available:
Detailed Execution Logging
- Select task executions are fully logged with input and output data
- Request and response payloads are captured
- Task execution times are recorded
- Error details are preserved with full context
Debug data can be accessed via the Metrics dashboard on the Usage Data tab as shown in the metrics section.
Enabling Debug Mode
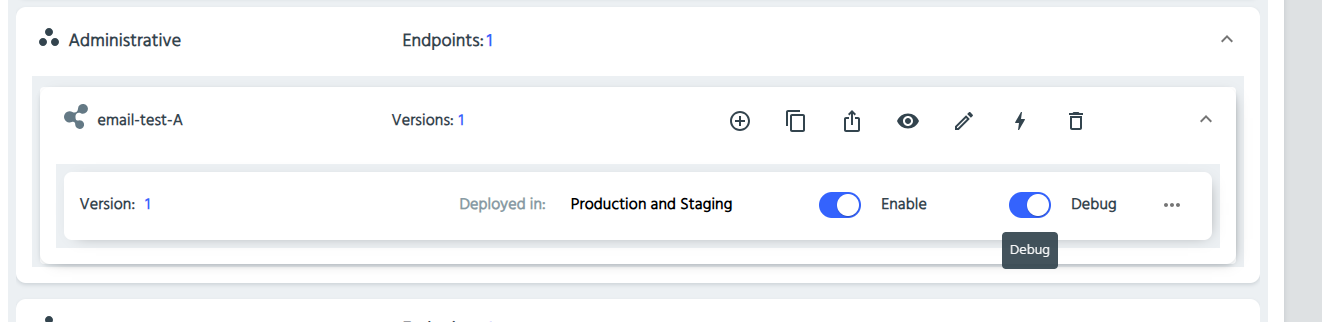
Debug Mode can be set for each endpoint version. It defaults to OFF. It can be enabled as follows:
- Navigate to the Endpoints section
- Select the endpoint you wish to debug
- Toggle the "Debug Mode" switch to the ON position
Security Considerations
Important: Debug Mode may expose sensitive information in logs. Exercise caution when using this feature:
- Only enable Debug Mode when actively troubleshooting an issue
- Deactivate Debug Mode in production environments when not needed
- Be aware that sensitive data like authentication tokens, personal information, or confidential business data may be visible in debug logs
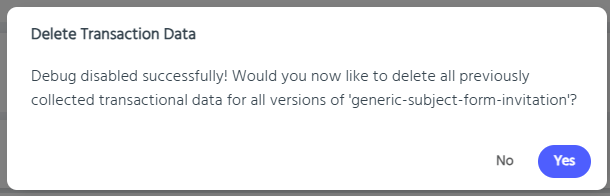
- When disabling Debug Mode you will also have the option to delete all debug data for this endpoint. If you choose not to delete the debug data at this point, you will be able to do this later on. Please read the Clear Debug Data section below for more information.
Clearing Debug data
To remove all debug information for an endpoint from the system:
- Navigate to the Endpoints section
- Select the endpoint you wish to delete debug data for
- Click on the three-dots menu (...)
- Select "Delete debug data" from the menu
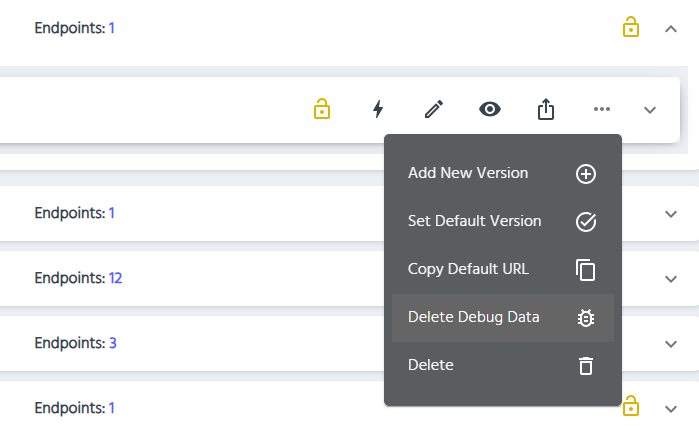
- Click "Okay" to delete.
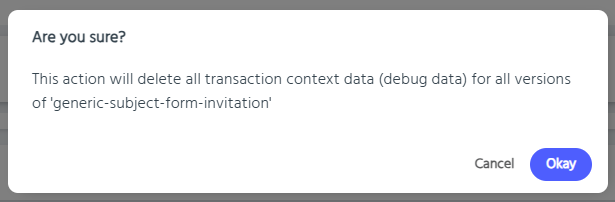
Please note this will delete debug data for all versions of that endpoint.
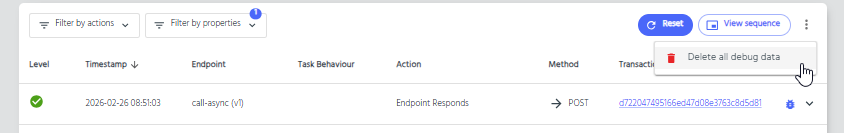
To remove all debug information from the system:
- Navigate to the Metrics section
- Select the "Usage Data" tab
- Click the three-dots menu (⋮) in the upper right corner
- Select "Delete all debug data" from the dropdown menu
This operation cannot be undone, so ensure you no longer need the debug information before proceeding.